 This project is developed as mid-term for P2P Course, one of my Master Degree’s course. The assignment is to develop a chord simulation and analyse the topology and the network performance. First of all, in order to replay to my colleague, why I’ve chosen Javascript? Because in the last period I’ve found various features and libraries that I wanted to try, moreover there was not language constraint on this assignment… so, JAVASCRIPT!
The project is online here.
The project
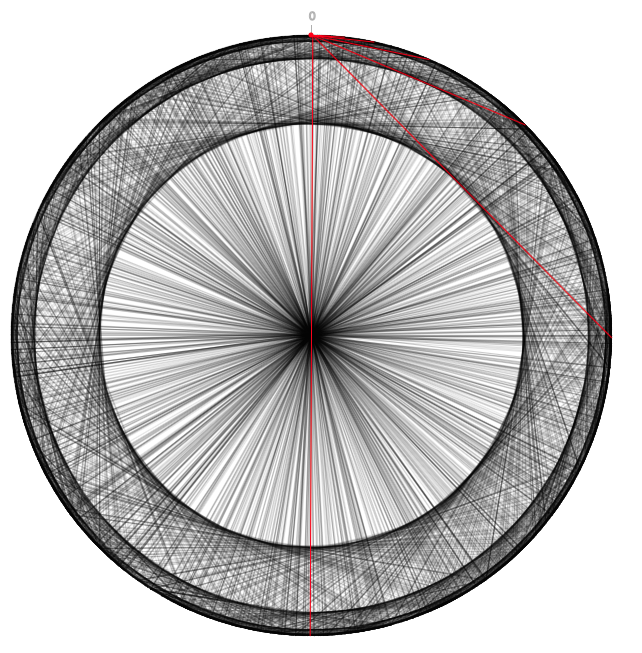
This project borns with the aim to analyze the Chord overlay network topology and routing. We can generate, each time, a Chord graph and performs, from each node, a key lookup. The data generated are stored in a variable that, after some processing, is used to generate the graphs.
The collected statistical data are:
- Number of noded that a query have to traverse to return the owner of a key
- The number of links that a node has (in and out-going edges).
- Number of keys that a node owns
Default values
In order to execute the code faster, the following values are defined:
- Number of bits used to describe a key: 16 (instead of 160 of a SHA1)
- The simulation uses the SHA1 function but stores only the 16 less significant bits
- Number of nodes: 20
- This value is settable passing the parameter
nnin HTTP GET mode (e.g.https://apagiaro.it/chord/?nn=10)
- This value is settable passing the parameter
Performance
During this project, I focus the attention on the simplicity. It is not focused on the performance (i.e. some search that can be done by a binary search are done using a linear algorithms). However, you can try to increase the number of nodes and it generates the graph in a few seconds (try with nn=2000).
Graphs analysis
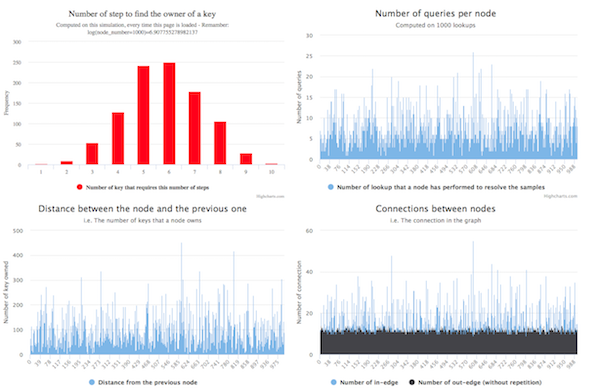
Under the network topology graph are shown four column graphs. They show the statistical data collected during the lookups in the network simulation.
The number of nodes traversed by a query is a Gaussian function where the higher value is the log(number_of_node), that is the same result that came from the mathematical analysis.
The distance between a node and its predecessor is correlated to the number of keys that a node owns. In our model, since the random distribution of the nodes (random generation of number combined with the SHA-1 function), we expect this value near to the maxId (2^address_size) divided by the nodes number.
Implementation and structure
This project is written in Javascript using some ES7 construct. In order to extend the browser compatibility, it is processed using Babel, that may generate some more complicated code. To permits a better legibility, all the code not processed by Babel is available on the GitHub repo of the project under the src directory.
The index.html is the object that you have to execute to view all the stuff described here. It references:
main.jsthat contains the Chord implementationvisualization.jsthat generates the overlay topology graphgraph.jsthat generates the graph uses to give a graphic explanation of the statistical datavisualization.js > setup() functioninstantiate all the graphic element included the start-up tutorial that is shown at the first visit (powered bydriven.js)
Libraries and Frameworks used
The components that I used:
- BigNumber: I discovered this library analyzing how Web3.JS (the standard library for the Smart Contract) manages the number that exceeds the maxInt in Javascript.
- p5.js: already known since I discovered Coding Train Youtube Channel, I was searching for a project to use it
- driver.js: a library to highlight some parts of the page and drive the user inside the website to explain something
- p5.gui.js: a library that, combined with p5.js, permits to generate automatically some controls over a set of variables
- Highcharts: used to render the fantastic columns graphs
Don’t forget to try it here